
Zoom icon

Hope and Wellbeing Data (2016-2018)

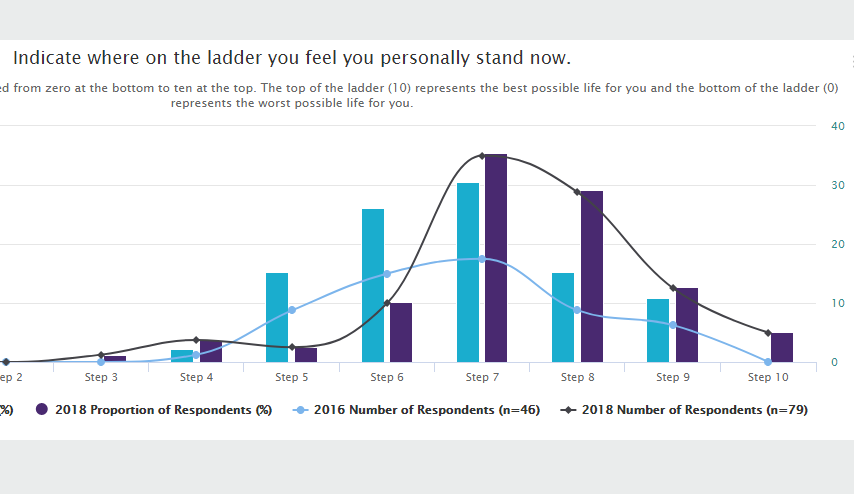
Across years, Vital Village has collected data using questions for the Hope and Wellbeing Survey as a part of our work with the 100 Million Healthier Lives initiative’s signature program: Spreading Community Accelerators through Learning and Evaluation (SCALE). Below are the results comparing 2016 and 2018 self-reported ratings.

March 15, 2019
Created with Highcharts 11.0.1Number of ResponsesResponse RateChart context menuIndicate where on the ladder you feel you personally stand now.Please imagine a ladder with steps numbered from zero at the bottom to ten at the top. The top of the ladder (10) represents the bestpossible life for you and the bottom of the ladder (0) represents the worst possible life for you.2016 Proportion of Respondents (%)2018 Proportion of Respondents (%)2016 Number of Respondents (n=46)2018 Number of Respondents (n=79)Step 0Step 1Step 2Step 3Step 4Step 5Step 6Step 7Step 8Step 9Step 1008162432010203040Step 10 2016 Proportion of Respondents (%): 0 2018 Proportion of Respondents (%): 5.06 2016 Number of Respondents (n=46): 0 2018 Number of Respondents (n=79): 4

Created with Highcharts 11.0.1Number of ResponsesResponse RateChart context menuIn general, how would you rate your physical health?2016 Proportion of Respondents (%)2018 Proportion of Respondents (%)2016 Number of Respondents (n=47)2018 Number of Respondents (n=78)PoorFairGoodVery GoodExcellent010203040015304560Fair 2016 Proportion of Respondents (%): 21.28 2018 Proportion of Respondents (%): 6.41 2016 Number of Respondents (n=47): 10 2018 Number of Respondents (n=78): 5
Get Involved

Your support makes a difference

Nurturing Leadership from the community, for the community